


The participant selection for the proteomics assays in ELSA is presented in Supplementary Fig. 1. A full list of the 276 proteins assayed (Unitprot ID, gene and protein name) is included in Supplementary Table 1. At ELSA study wave 4 in 2008, the participants included in the current study had a mean age of 63.5 years [standard deviation (SD) = 9.4], with 55% being female and 97% of White ethnicity (Table 1). 5.2%, 1.6%, 1.7%, 4.6%, 19.4%, and 2.0% had self-reported physician-diagnosis of cardiovascular disease (angina, heart attack, heart failure), stroke, cancer, diabetes, arthritis, and chronic lung disease at wave 4, respectively.
The wave 4 mean score for: (1) eudaimonic wellbeing (ranged 0–42, with higher score reflecting higher levels of wellbeing) measured using the 15 items of Control, Autonomy, Self-Realization and Pleasure (CASP) was 28.6 [SD = 6.9]; for (2) hedonic wellbeing (ranged 0–12, with higher score reflecting higher wellbeing) measured using the pleasure subscale of CASP was 10.0 [SD = 1.8]; for (3) life satisfaction (or evaluative wellbeing) (ranged 0–30, with higher score reflecting higher wellbeing) measured using the Diener Life Satisfaction scale (SWLS) was 20.4 [SD = 6.2]; and (4) depressive symptoms (ranged 0–8, with higher score reflecting a higher number of depressive symptoms) measured using the Center for Epidemiological Studies-Depression scale (CESD) was 1.3 [SD = 1.8], with 18.1% defined as having depression using the 3.0 cut-off point on CESD.
Correlation matrices showing the Spearman’s rank correlation coefficient (ρ) between wellbeing measures and depressive symptoms by study wave were included in Supplementary Fig. 2. The strongest correlations were observed between eudaimonic and hedonic wellbeing across waves (ρ = 0.48 to 0.70), indicating a positive relationship between these two measures of wellbeing. Additionally, moderate positive correlations were found between eudaimonic wellbeing and life satisfaction across waves (ρ = 0.45 to 0.61).
Analysis 1: Cross-sectional protein-wellbeing associations at wave 4
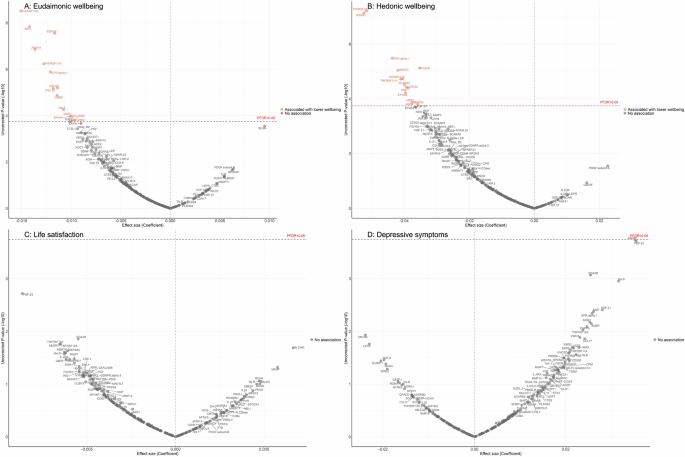
At Wave 4 in 2008, results from the cross-sectional linear regression models after minimal adjustments for age, sex, wealth quintile, and ethnicity are shown for eudaimonic wellbeing (Supplementary Fig. 3A; Supplementary Table 2), hedonic wellbeing (Supplementary Fig. 3B; Supplementary Table 3), life satisfaction (Supplementary Fig. 3C; Supplementary Table 4) and depressive symptoms (Supplementary Fig. 3D; Supplementary Table 5).
After further adjustment for the presence of six physician-diagnosed chronic diseases (cardiovascular disease, arthritis, cancer, diabetes, chronic lung disease, and stroke), and smoking status, the results revealed that higher eudaimonic wellbeing was associated with lower concentrations of 14 proteins (TNFRSF10A, KIM1 (also known as HAVCR1), EDA2R, ASGR1, TNFRSF11A, GFR.alpha.1 (also known as GFRA1), UNC5C, FGF.23, AMBP, Gal.9 (also known as LGALS9), EFNA4, MSR1, SCARB2, CD302; Fig. 1A; Supplementary Table 6), and higher hedonic wellbeing was associated with lower concentrations of 14 proteins (TNFRSF10A, ASGR1, GFR.alpha.1, EDA2R, UNC5C, TNFRSF12A, TNFRSF11A, SCARB2, VSIG2, KIM1, EPHB6, AMBP, MSR1, SKR3 (also known as ACVRL1; Fig. 1B; Supplementary Table 7) (all PFDR (False Discovery Rate-corrected p-value) < 0.05). No protein was associated with life satisfaction (Fig. 1C; Supplementary Table 8), and we did not find any proteins that showed a positive association (increased abundance) with any dimension of wellbeing. No protein was associated with the level of depressive symptoms (Fig. 1D; Supplementary Table 9), nor with depression (Supplementary Fig. 4A; Supplementary Table 10).

Linear regression models for protein-wellbeing (A Eudaimonic wellbeing, B Hedonic wellbeing, C Life satisfaction, D Depressive symptoms) associations at wave 4. Models adjusted for age, sex, wealth quintile, ethnicity, smoking status, arthritis, cancer, stroke, chronic lung disease, diabetes, cardiovascular diseases.
Further adjustment for body mass index (BMI) showed that several cross-sectional protein associations with eudaimonic wellbeing persisted (TNFRSF10A, KIM1 (also known as HAVCR1), EDA2R, ASGR1, TNFRSF11A, GFR.alpha.1 (also known as GFRA1), UNC5C, FGF.23) (Supplementary Fig. 5A; Supplementary Table 11), and with hedonic wellbeing (TNFRSF10A, ASGR1, GFR.alpha.1, EDA2R, UNC5C, TNFRSF12A, TNFRSF11A, SCARB2, VSIG2, KIM1, EPHB6) (Supplementary Fig. 5B; Supplementary Table 12). For life satisfaction (Supplementary Fig. 5C; Supplementary Table 13) and depressive symptoms (Supplementary Fig. 5D; Supplementary Table 14).
Mutually adjusting for eudaimonic and hedonic wellbeing did not show any significant associations (all PFDR for interaction >0.05).
No sex difference in any of the cross-sectional protein-wellbeing associations was observed (all PFDR for interaction >0.05) (Supplementary Tables 15–18).
Analysis 2: Longitudinal associations between protein measures at wave 4 and subsequent wellbeing measures over the next 15 years
In the longitudinal analyses from wave 4 (in 2008) to wave 10 (in 2023), the minimally adjusted results from the mixed-effect linear regression models (LMM) linking protein abundance to the trajectory of each wellbeing domain are provided in Supplementary Fig. 6, and in Supplementary Table 19–22. After full adjustments, higher concentrations of seven proteins (EDA2R, DCN, CD38, BNP, MERTK, MMP12, CTSL1) at wave 4 were associated with greater decline in levels of eudaimonic wellbeing in the subsequent years after protein measurement (Fig. 2A; Supplementary Table 23), while higher concentrations of two proteins at wave 4 were associated with increasing levels of eudaimonic wellbeing (ECE1, DEFB4A). Higher concentrations of eight proteins (DCN, MMP12, EDA2R, TNFRSF13B, SPON2, DRAXIN, MERTK, BNP) were associated with greater decline in levels of hedonic wellbeing (Fig. 2B; Supplementary Table 24). Two proteins (KIM1, EDA2R) were associated with greater decline in levels of life satisfaction (Fig. 2C; Supplementary Table 25) (all PFDR < 0.05), while one protein (ECE1) was associated with a slower rate of decline in life satisfaction. No protein was associated with the rate of change in the number of depressive symptoms (Fig. 2D; Supplementary Table 26), and no protein was associated with the rate of change in the odds of depression, which was modelled using mixed-effect logistic regressions (MLR) (Supplementary Fig. 4B; Supplementary Table 27).
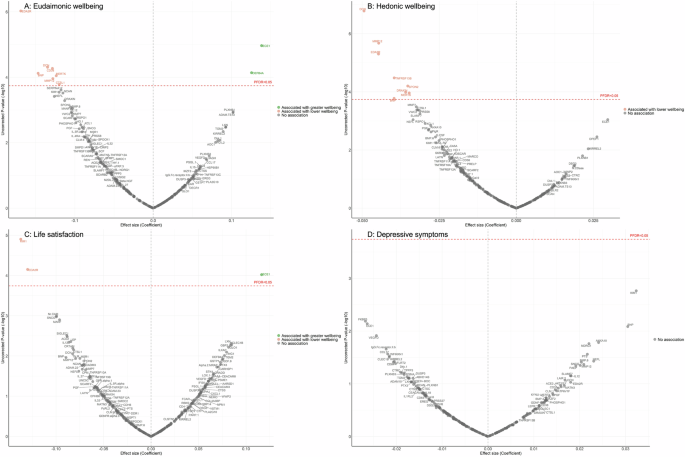
Linear mixed effect regression models for protein-wellbeing (A Eudaimonic wellbeing, B Hedonic wellbeing, C Life satisfaction, D Depressive symptoms) associations from wave 4 to wave 10. Models allowed for protein interacting with time since protein measurements, and adjusted for baseline age, sex, wealth quintile, ethnicity, smoking status, arthritis, cancer, stroke, chronic lung disease, diabetes, cardiovascular diseases.
Further adjustment for BMI largely confirmed the findings described above (Supplementary Table 28–31), with only the association between higher concentrations of BNP and the estimated trajectory of hedonic wellbeing showing attenuation (Supplementary Fig. 7B).
For eudaimonic wellbeing, after further adjustment for hedonic wellbeing, the association between higher concentrations of DEFB4A and the rate of change remained significant, showing a positive effect on eudaimonic wellbeing over the 15-year follow-up (coefficient (β) [se] = 0.135 [0.029], PFDR = 0.001). This indicates a distinct and independent relationship eudaimonic wellbeing.
Some notable sex differences were observed (Supplementary Table 32–35). Higher XCL1 concentration was associated with greater decline in levels of eudaimonic wellbeing in males (PFDR for interaction = 0.004; β [se] = −0.24 [0.046], PFDR = 3.32 × 10⁻⁵), while it was not significantly associated in females (β [se] = 0.003 [0.041], PFDR = 1.00). This finding of moderation in the longitudinal XCL1-wellbeing association was not attributed to sex differences in levels of XCL1 expression at baseline (p = 0.93).
For hedonic wellbeing, higher concentration of SLAMF7 was also associated with greater decline in levels of hedonic wellbeing in males (PFDR for interaction = 0.02; β [se] = −0.072 [0.014], (PFDR = 6.42 × 10⁻⁵), but not in females (β [se] = 0.0007 [0.012], PFDR = 1.00). Testing for differences in protein expression by sex revealed a significant sex difference (p = 0.001), with higher SLAMF7 expression observed in males compared to females.
Internal validation using cluster-level 5-fold cross-validation was applied to evaluate the robustness of protein-wellbeing associations derived from the linear mixed-effects models (Supplementary Tables 36–39). Proteins that were statistically significant in the main models (PFDR < 0.05) were consistently among the strongest contributors to prediction. Cross-validation also indicated, however, that predictive accuracy benefited from the combined contribution of a broader set of proteins, particularly for eudaimonic and hedonic wellbeing, consistent with small, distributed effects across the proteome. Cross-validated Root Mean Square Error (RMSE) values were highly stable across proteins (range: 6.559–6.593 for eudaimonic wellbeing, 1.735–1.744 for hedonic wellbeing, 6.005–6.014 for life satisfaction, and 1.718–1.722 for depressive symptoms), demonstrating consistent predictive performance across folds. While this supports the robustness of estimates within the sample, external validation will be required to confirm generalizability to independent populations. Overall, these findings suggest that although certain proteins show robust statistical associations, their isolated predictive utility at the individual level remains limited, with more meaningful prediction emerging from distributed multivariate patterns.
Analysis 3: Longitudinal associations between protein measures at wave 4 and wellbeing in the previous 6 years
Participants scores across the measures of wellbeing were modelled over the six years before protein measurement, spanning wave 1 (in 2002) to wave 4 (in 2008), except for life satisfaction which was modelled from wave 2 (in 2004) to wave 4 (in 2008). Minimally adjusted findings for each wellbeing domain are shown in Supplementary Fig. 8 and in Supplementary Table 40–43.
Fully adjusted results from LMM indicate that higher concentrations of four proteins (NEFL, KIM1, EDA2R, GFR.alpha.1) were associated with greater decline in levels of eudaimonic wellbeing in the preceding years (Fig. 3A; Supplementary Table 44), while 12 proteins (NEFL, SMOC2, GFR.alpha.1, DCN, SCARF2, TNFRSF12A, EDA2R, SCARA5, PDGF.R.alpha, MATN3, SCARB2, KIM1) were associated with greater decline in hedonic wellbeing (Fig. 3B; Supplementary Table 45) (all PFDR < 0.05). Higher concentration of one protein (PSG1) was associated with greater decline in life satisfaction (Fig. 3C; Supplementary Table 46). No protein was associated with the level of depressive symptoms (Fig. 3D; Supplementary Table 47); or with the binary outcome of depression (Supplementary Fig. 4C; Supplementary Table 48). Further adjustment for BMI, based on the fully adjusted models, yielded results largely consistent with those described above, with higher concentrations of KIM1 showing an additional association with lower hedonic wellbeing (Supplementary Fig. 9) (Supplementary Table 49–52).
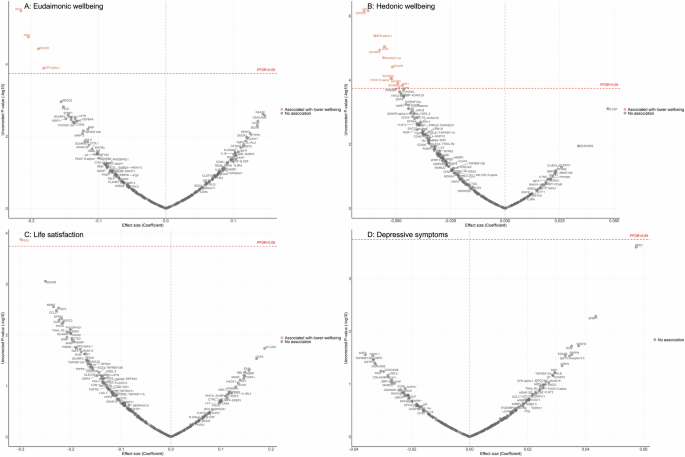
Linear mixed effect regression models for protein-wellbeing (A Eudaimonic wellbeing, B Hedonic wellbeing, C Life satisfaction, D Depressive symptoms) associations from wave 1 to wave 4 (except for life satisfaction, while was from wave 2 to wave 4). Models allowed for protein interacting with time since protein measurements, and adjusted for baseline age, sex, wealth quintile, ethnicity, smoking status, arthritis, cancer, stroke, chronic lung disease, diabetes, cardiovascular diseases.
No significant associations were observed after mutually adjusting for eudaimonic and hedonic wellbeing.
No differences by sex were observed for the longitudinal associations between protein concentration and wellbeing measured in the years before protein assays (all PFDR for interaction >0.05) (Supplementary Table 53–56).
Cluster-level 5-fold cross-validation produced results consistent with the main analyses (Supplementary Tables 57–60), supporting the robustness of significant protein–wellbeing associations. For hedonic wellbeing, predictive accuracy benefited from the contribution of a broader set of proteins. Cross-validated RMSE values were highly stable across proteins (range: 6.287–6.319 for eudaimonic wellbeing, 1.644–1.652 for hedonic wellbeing, 6.123–6.133 for life satisfaction, 1.809–1.814 for depressive symptoms), indicating consistent predictive performance across validation folds.
Figure 4 summarizes the effect sizes of the cross-sectional and longitudinal associations – both before and after protein measurement – between protein concentrations and the various dimensions of wellbeing, with the significance level of the associations being indicated by PFDR.

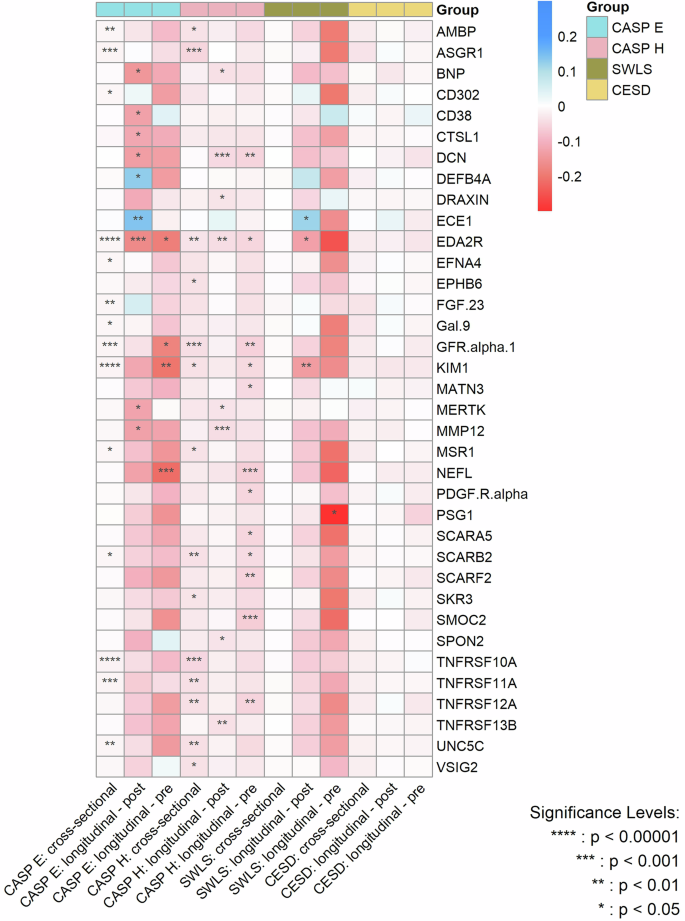
CASP E control, autonomy, self-realization and pleasure eudaimonic wellbeing, CASP H control, autonomy, self-realization and pleasure hedonic wellbeing, SWLS diener life satisfaction scale, CESD center for epidemiological studies-depression scale. P values are after false discovery rate (FDR) correction.
Analysis 4: Enrichment network analysis of the identified proteins
Enrichment network analysis suggested several enriched pathways for all identified proteins in the observed cross-sectional and longitudinal associations with eudaimonic wellbeing (Fig. 5; Supplementary Table 61), hedonic wellbeing (Fig. 6; Supplementary Table 62), and life satisfaction (Fig. 7; Supplementary Table 63).

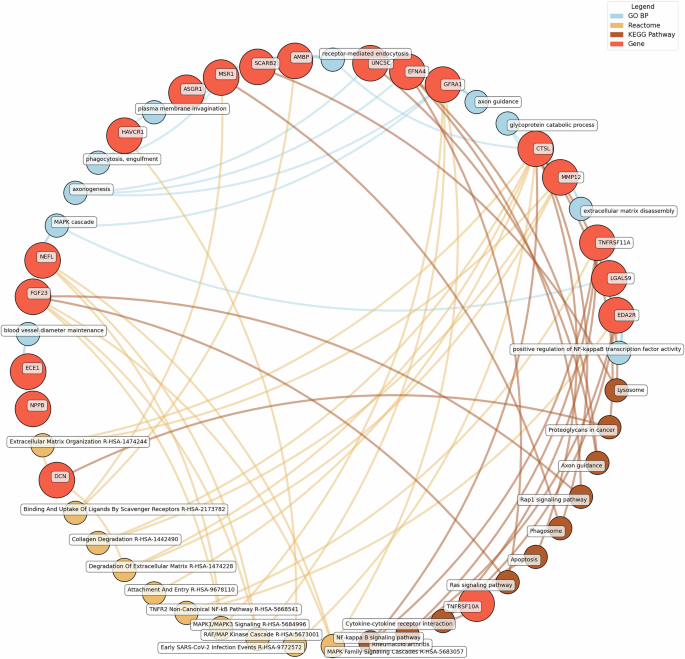
GO BP gene ontology – biological processes, Reactome a database of reactions, pathways and biological processes, KEGG Kyoto Encyclopedia of genes and genomes. The ‘node’ indicates the gene name corresponding to the protein, or the biological term extracted from each bioinformatics library, the ‘edge’ connects protein to their enriched term.

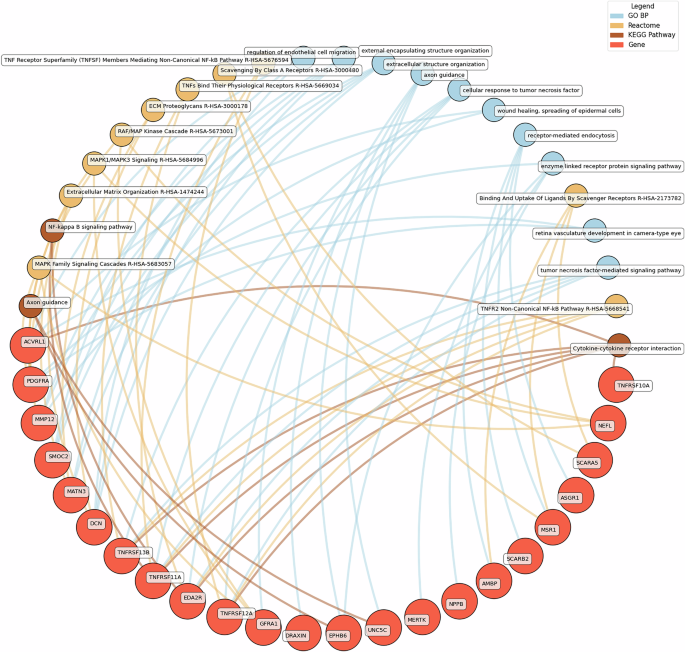
GO BP gene ontology – biological processes, Reactome a database of reactions, pathways and biological processes, KEGG, Kyoto Encyclopedia of genes and genomes. The ‘node’ indicates the gene name corresponding to the protein, or the biological term extracted from each bioinformatics library, the ‘edge’ connects protein to their enriched term.

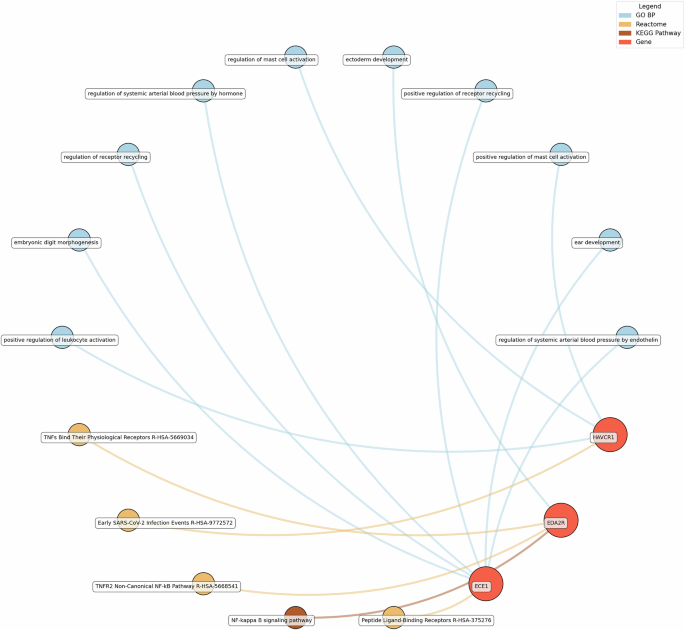
GO BP gene ontology – biological processes, Reactome a database of reactions, pathways and biological processes, KEGG Kyoto Encyclopedia of genes and genomes. The ‘node’ indicates the gene name corresponding to the protein, or the biological term extracted from each bioinformatics library, the ‘edge’ connects protein to their enriched term.
Significant pathways enriched for low eudaimonic wellbeing included NF-κB signaling, cytokine-cytokine receptor interactions, and MAPK family signaling cascades, along with extracellular matrix organization and axon guidance. Proteins such as EDA2R, LGALS9, and TNFRSF11A were linked to NF-κB transcriptional activity, while MMP12 and CTSL contributed to extracellular matrix disassembly and glycoprotein catabolism.
Low hedonic wellbeing was particularly associated with TNF-mediated pathways, with proteins such as TNFRSF13B and EDA2R participating in TNF signaling. Extracellular structure organization and axon guidance were also enriched, with contributions from proteins such as DCN, MMP12, and GFRA1.
For life satisfaction, pathways related to systemic arterial blood pressure regulation, receptor recycling, and ectoderm development were prominent, with proteins such as ECE1 and KIM1 (also known as HAVCR1) playing key roles.
Eudaimonic, hedonic, and life satisfaction wellbeing share several biological pathways and processes, reflecting overlapping molecular mechanisms (which is unsurprising given the substantial overlap in protein correlates of each type of wellbeing, e.g., among the higher concentrations of 14 proteins linked to low hedonic wellbeing or low eudaimonic wellbeing, 8 were shared). Common shared pathways include the NF-κB signaling pathway, which is central to inflammatory and immune responses, and the cytokine-cytokine receptor interaction pathway, involved in intercellular communication during immune processes. Additionally, the MAPK signaling cascades, crucial for cellular responses to environmental stimuli, are shared between eudaimonic and hedonic wellbeing.
link